CFD

Perform Descriptive Statistics

08 Apr 2019

Are you new to Statistics? Orange is an open source machine learning and data visualization product. In this article, we will take a quick look into how to perform descriptive statistics very easily.

Step 1 : Open Orange software Click on Data>File and upload a dataset

We can see the characteristics of the dataset
Step 2 : Click on "Data Table" in the Data Section We can now visualize the dataset as a table
Step 3 : From the Visualize section, click on "Box Plot", "Distribution" and "Scatter Plot" The "Feature Statistics" is in the Data Section
You're done! Now you can see values when analyzing data such as: 1. Feature Statistics

2. Box Plot

3. Distributions

4. Scatter Plot


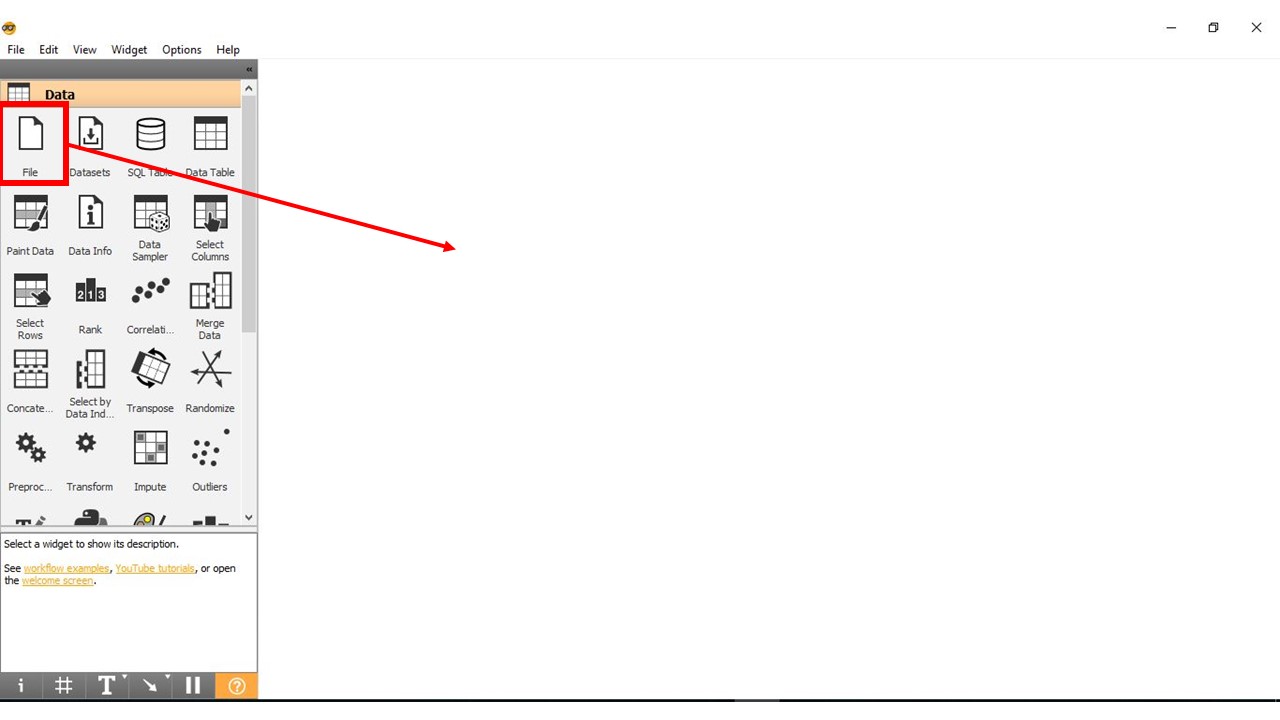
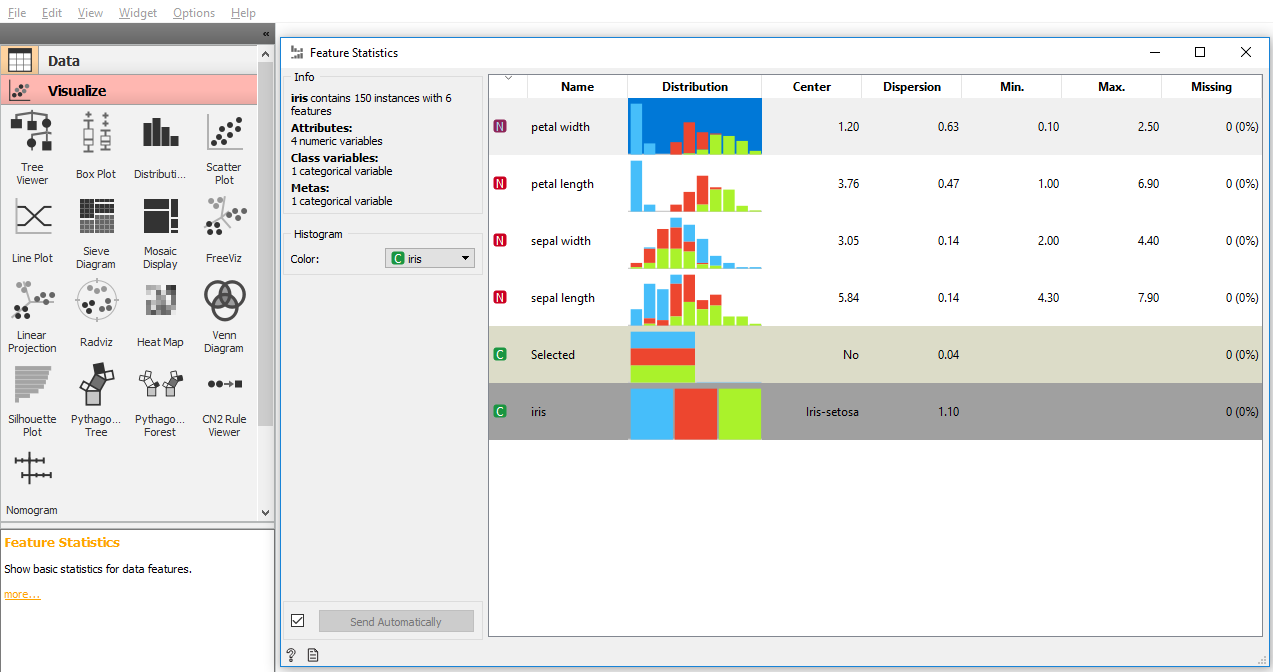
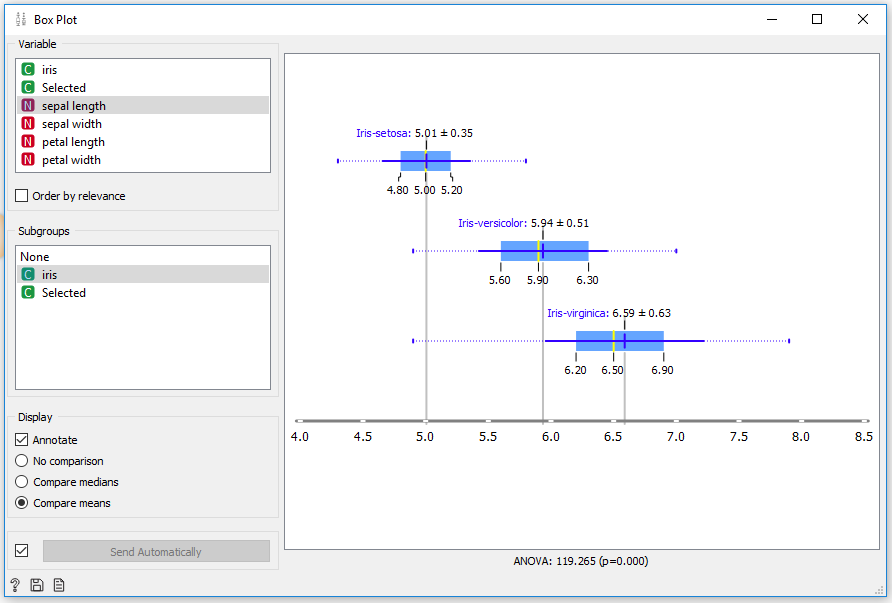
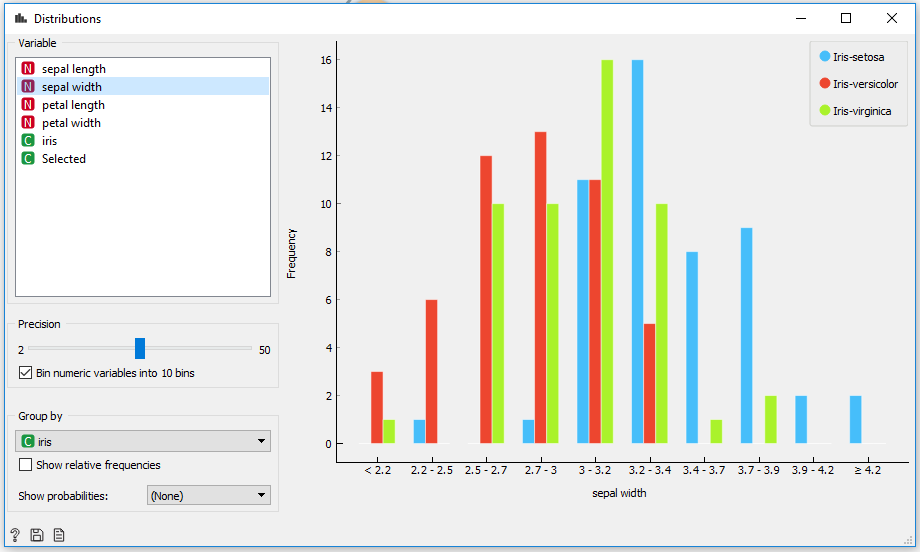
One of the most valuable things about Orange is its speed to perform quick statistical analysis. However, the data is not presented as a file, nor as a table in order to export. As a consequence, values such as Standard Deviation or Variance have to be calculated from the results given in Box Plots, Distributions, etc.